When you launch your first SaaS there's a steep learning curve around the topic of the metrics: LTV, MRR, net revenue churn, COGS, ARPU, quick ratio - to name just a few.
Fear no more because in this guide you'll find explanations, formulas, and tips for improvement for each metric.
Table of Contents (click to expand)
- Average Revenue Per User - ARPU
- Why ARPU is important?
- Calculating net ARPA
- Improving your Average Revenue Per User
- Estimating your (competitor's) ARPA
- Monthly Recurring Revenue (MRR) and Annual Recurring Revenue (ARR)
- How to factor annual revenue into your MRR calculation
- What to account for in the MRR calculation
- Common pitfalls when calculating MRR
- What's the case with Annual Recurring Revenue?
- Ways to improve your MRR
- Customer Acquisition Cost - CAC
- The difference between CAC and CPA
- Calculating the Customer Acquisition Cost - CAC
- Accounting for delayed sales cycles in your calculations
- CAC considerations for freemium products
- Track CAC by traction channel
- Ways to lower your CAC
- CAC payback period
- Why the CAC payback period is important
- How to calculate your CAC payback period
- How to recoup your CAC faster
- Churn & Retention
- Customer churn vs. revenue churn
- Net revenue Churn and the Holy Grail of Net Negative Churn
- So what is net negative revenue churn?
- How to achieve net negative churn
- Reasons customers churn
- How to reduce churn in your subscription business
- Customer Lifetime Value - LTV / CLTV / CLV
- Why Customer Lifetime Value is such an important metric
- How to calculate customer lifetime value
- Calculate your customer lifetime value for different segments
- LTV to CAC ratio
- The rule of Thirds
- Compound Annual Growth Rate - CAGR
- Customer churn vs. revenue churn
- Net revenue Churn and the Holy Grail of Net Negative Churn
- So what is net negative revenue churn?
- How to achieve net negative churn
- Reasons customers churn
- How to reduce churn in your subscription business
One challenge when running a subscription-based Software-as-a-Service (SaaS) business is that the metrics you as the owner care about are quite different from other business ventures.
With an ecommerce or infoproduct business you get all the money the moment a user buys your product. With a SaaS it takes months to even recoup the money you expended to acquire a new customer.
And that is just one way that SaaS is different from most other businesses.
Good news: This guide on SaaS Metrics explains it all in plain English. It teaches you what each of those fancy acronyms like ARPU, CAC, and MRR means.
But not only that, you'll also learn how that metric influences your business and how you can improve each one.
Let's dive in!
Average Revenue Per User - ARPU / ARPA
ARPU - which sounds a bit like someone sneezing - is the short-hand for "Average Revenue per User". ARPA means "Average Revenue per Account". Both terms are interchangeable.
Some people even use ARPC ("Average Revenue per Customer/Client"), but ARPU and ARPA are the most commonly used abbreviations.
For SaaS businesses ARPU is calculated on a monthly basis. It answers the question "How much money do we make each month per user on average?"
Here's an example: you have 50 users and last month's revenue was $2,000.
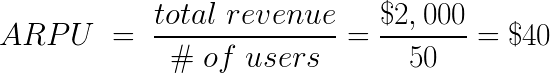
In this case you make an average of $40 from each account every month.
Why ARPU is important?
ARPU is an important metric because it comes up in the calculations for monthly recurring revenue (MRR) and customer lifetime value (LTV).
ARPU also gives you an idea of what is driving revenue - e.g. if you've left pricing untouched for a while and your ARPU is still growing this might be due to customers naturally moving into higher tier plans.
Calculating net ARPA
Sometimes you don't want to know how much revenue you get per paying account, but rather "how much does each account contribute to paying the bills for fixed costs?"
You can answer that question by deducting the costs it takes to service each account from the ARPA. These costs are called Costs of Goods Sold (COGS).
For example, say it costs you $7 per month to service each account. You then deduct $7 from $40 and get $33. So your net ARPA is $33.

Those $33 can be used to pay for marketing, sales, development, employee benefits, blow or any of the other essential items on the budget. Or in some rare cases you can use those $33 to turn a profit. gasp
Okay, jokes aside. You use those $33 to pay your bills that are not directly related to servicing your customers. And after the bills are paid, each account gives you another $33 of profit per month.
Improving your Average Revenue Per User
Look: ARPU is a central number in your business. When you manage to increase it, your lifetime value and your MRR both increase.
That means you make more money each month and your unit economics increase as well.
So how do you increase your average revenue per user?
It's pretty obvious when you think about it: You raise prices.
Higher prices will increase the average revenue as new users sign up and older users on lower plans cancel their subscription.
When you increase prices I recommend you grandfather in your existing customers, meaning you do not increase their prices, but reward their loyalty by keeping them on the same low prices they signed up for. Deviate from this procedure only if necessary.
You may wonder whether increasing prices will hurt your signup rates, but chances are you decided on plans and prices when you launched and haven't tested them a whole lot since then. So there's probably room for improvement.
Additionally, you added a number of features and improvements to your product since the last pricing update. So it's only natural to increase your prices to account for the increase in value you deliver.
Patrick McKenzie once remarked that the best way to find your ideal pricing is to double prices and watch your signup rates. If they don't drop enough to cancel the benefits of the new pricing, double your prices again.
Remember: If it's stupid, but it works, it ain't stupid.
Re-Designing your plans to improve ARPU
Secondly, you can improve your average revenue per account by re-packaging your plans so that more users end up in higher tier plans.
For example: if you previously allowed people on the middle tier to do 100 searches per month and you cut that down to 50 searches a month, some users will be above that threshold and end up in higher plans. That increases your ARPU.
You can also adjust the copy and design of your pricing page to nudge people into higher tiers. For example, you can change the names of your plans from "Silver, Gold, Platinum" to "Freelancer, Agency, Enterprise" - if applicable. This helps your customers self-select and you'd be surprised by the emotional logic that drives some of our decisions.
Frankly, there are dozens of ways you can change your pricing page to improve your ARPU. I recommend reading Predictably Irrational* for some great stories with fantastic examples.
Replacing your monthly plans with annual plans
Lastly, another tactic for improving your ARPU is to introduce and highlight annual billing at the old prices while simultaneously introducing new higher monthly prices.
For example, you have a plan that is $79/month. You change that plan to "$79/month, billed annually" and introduce a new monthly plan of $99.
This slightly improves your ARPU as you raise prices, but more importantly, it encourages users to select annual plans where you get a huge chunk of cash upfront, which helps your cash flow.
Estimating your (competitor's) ARPA
I first heard about this trick on an episode of the Startups for the Rest of Us podcast and it's super handy if you want to guesstimate what your competition's ARPA is.
Or maybe you're pre-launch and want to guestimate your own future ARPA to draw some charts or whatever.
Anyways, here's an easy way to do that:

If the SaaS has three tiers (e.g. $39, $79, $149/mo) the ARPA will be close to the average of the prices of the lower two tiers:

If the SaaS has four tiers (e.g. $15, $25, $65, $100) will roughly be the price of the second lowest tier plus 10%. In our example that formula results in:

Monthly Recurring Revenue (MRR) and Annual Recurring Revenue (ARR)
Excuse the poor analogy, but the LOTR fan in me just couldn't pass on this.
Anyways, let's talk about the one metric we've all heard about: Monthly recurring revenue or MRR for short. We'll also talk about Annual Recurring Revenue a.k.a. Annual Run Rate a.k.a. ARR.
MRR is the holy grail for bootstrappers and self-funded software founders with its promise of a steady, guaranteed income stream. No more starting over at $0 each month. That's why we'll explore what's behind this metric in depth.
Let's dive in.
Monthly recurring revenue is the metric for any SaaS business. If it goes up, good; if it goes down, bad.
A basic definition of MRR is the sum of monthly subscription revenue from all accounts.
It sounds simple, but there are a few things that need further explanation:
- What do you mean by subscription revenue?
- What gets included in and excluded from MRR?
- What is "monthly"? What happens to revenue from annual plans?
For starters, subscription revenue means any revenue that gets billed at pre-determined intervals as part of an ongoing contract. That contract normally auto-renews and gets billed every month. But it could also be an annual plan that gets billed up-front for the whole year or an annual that gets billed monthly or a quarterly plan.
How to factor annual revenue into your MRR calculation
Wait a minute: What does an annual plan have to do with monthly recurring revenue?
Picture this: you have 100 customers that pay you $10 a month year-round - your MRR is $1,000. Cool, right?
Now when you have a single customer that pays you $12,000 every January, does that mean that your MRR for February through December is $1,000 and in January it jumps to $13,000? Or do you simply neglect annual revenue when calculating MRR? But you're getting that money, so the IRS wouldn't be too happy about that! Clearly, one can't ignore it.
Luckily though, the solution is easy & straight-forward. You divide the annual revenue by 12 and split it across every month. So your MRR would be $1,000 from 100 monthly subscriptions plus another $1,000 from the annual subscription = $2,000.
The same logic applies to bi-annual (divide by 6) or quarterly (divide by 3) billing. And if you're billing weekly, I'm sure there is a special place in hell reserved just for you. I jest... multiply the weekly revenue by 4.33 (52 weeks divivded by 12 months = 4.33 weeks/month) and you're good to go.
What to account for in the MRR calculation
This question is straight-forward: You include all recurring payments from all accounts in your MRR calculation. You account for any recent signups, any cancellations, downgrades, upgrades, and discounts.
You determine your MRR at a point in time; not over a time range. Normally, you either calculate your MRR right now or when you're looking back (e.g. "what was my MRR in January 2018?") you're looking at the MRR at the end of the month.
So it doesn't matter whether an account has upgraded to a higher tier 5 seconds or 5 years ago. Right now they are on the higher tier plan and that's all you need for MRR calculation.
Furthermore, you need to account for discounts. Say you have a customer on a $100/month plan and they have a $30/month discount. To calculate your MRR you count that customer with $70/month, not with $100/month.
Common pitfalls when calculating MRR
Some things are best explained by looking at how NOT to do it.
So here are the most common mistakes that happen when calculating MRR.
Subtracting transaction fees from MRR
At first glance it might seem like a good idea to deduct any transaction and foreign exchange fees from your MRR. After all, you never see any of that money hitting your bank account - right?
However, I advise to first take those fees in as revenue and then deduct them again as expenses. The reason is simple: You can optimize those expenses.
Example fee calculation for different payment providers
Let's look at an example: You have 650 customers, each on the $40/month plan, for a combined MRR of $26,000 (USD). Your business is registered in Germany and your bank account is in Euros (EUR).
You're processing all of your payments through Gumroad with money transferred to your PayPal account, so your fees are as follows:
- $0.30 per transaction for 650 transaction: $195
- 8.5% transaction fee: $2,210
- 3.5% foreign exchange fee from PayPal: $910
Your monthly total expenses with this setup (Gumroad + Paypal) are $3,315.
Compare that to using Stripe and paying directly to your bank account:
- $0.30 per transaction for 650 transactions: $195
- 2.9% transaction fee: $754
- 2% foreign exchange fee: $520
With Stripe your monthly expenses are $1,469 - or roughly 44% of the costs of using Gumroad + Paypal.
In other words, you can add a bit over $1,800 to your bottom line with "simply" switching payment providers.
Check out our annual revenue estimator for subscription-based businesses to get an idea about how transaction and foreign fees compare between popular payment providers.
Bonus Tip: If you're making more than about $25,000 MRR, you should ask your payment provider for volume discounts.
Including one-time payments in your MRR
Another common pitfall: Including non-recurring (one-time) payments in your MRR.
This is especially tricky if you're charging some one-time charges (e.g. implementation fees or service charges) along your monthly subscription fees.
Adding revenue from trial accounts to your MRR
Trial accounts are not (yet) contributing to your bottom line, so make sure to filter them out before calculating your MRR.
Subtracting failed charges from your MRR
On the other end of the spectrum there are accounts with failed charges a.k.a. delinquent accounts.
Here you need to include them in your MRR calculation, because they have not ultimately churned. Chances are the charge will go through if you attempt it again and they'll continue to be a customer.
What's the case with Annual Recurring Revenue?
Annual Recurring Revenue a.k.a. Annual Run Rate a.k.a. ARR is the annual version of MRR.
ARR is often used by companies who make more than $10,000,000 in revenue per year. It's easier to comprehend the difference between $10M and $15M ARR than the difference between $833,333 and $1,250,000 in MRR.
ARR is also a more natural way of talking about revenue if the majority of revenue comes from annual contracts as is often the case when selling to enterprise customers.
Ways to improve your MRR
You can influence your MRR by a number of means, most commonly by increasing either ARPU, number of signups (discussed in the chapter on CAC) or by decreasing churn. Those tactics are discussed in their respective chapters.
But here are some tactics that increases MRR that are not mentioned in any of the other chapters.
Get more (targeted) traffic to your website
One way to get more signups is to increase the traffic of your website. The more qualified traffic you get, the more people will sign up for your product.
You can achieve this through SEO, paid ads, social media marketing, content marketing, etc. Here are some ressources in case you're interested in traffic channels:
- "Traction: How Any Startup Can Achieve Explosive Customer Growth"* - gives a good overview over different growth channels
- Beginner's Guide to SEO
- Google Adwords: The Beginner's Guide
- Beginner's Guide to Facebook Ads
- Beginner's Guide to Content Marketing
There are also some cool ideas available in this blog post.
MRR Growth Ceiling - MGC
The MRR growth ceiling is a semi-important metric that answers the question "Given the current state of our business, at what point will our MRR stop to grow?"
Why the MRR growth ceiling is semi-important
Knowing where the theoretical limit for your growth is, sounds like a good idea - right? I mean, that number could be helpful to know whether you'll eventually be able to grow your business to profitability.
The problem with the MRR growth ceiling is that as your MRR increases, so does your churn in absolute numbers. You'll approach teh MRR growth ceiling asymptotically. The closer you get to the ceiling, the smaller the increments to your MRR so that you'll never quite hit the ceiling. Here's a chart that should make that part very clear:
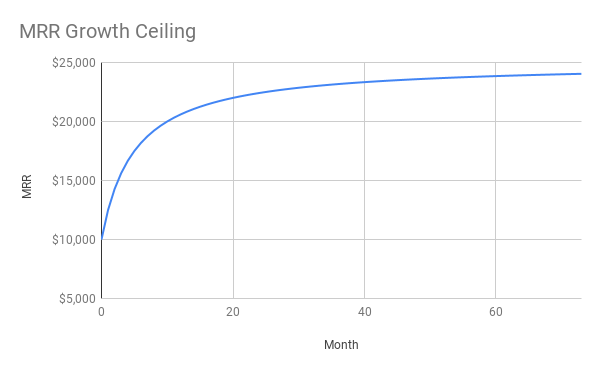
As you can see, this business starts to grow at a phenomenal 25% growth rate in the first month and quickly levels off. It grows from $10,000 to $17,500 (the half-way point towards $25,000) in just five months.
But then it takes another five months to grow to $20,000 and to get to $24,000 takes a total of 70 months - or almost six years.
The lesson here is this: You need to constantly push to move your MRR growth ceiling away from your current MRR or else growth will slow down. Try to keep your growth ceiling above your current MRR - everything else will be an unpleasant experience.
Calculating your MRR growth ceiling
To calculate your MRR growth ceiling you multiply your ARPU with the number of signups you get per month, multiply that result by 100 and divide it by your churn rate:

It's really not that complicated. To improve your revenue growth ceiling, just follow any of the instructions in the chapters on MRR, ARPU or churn. They all factor into the calculation for the MRR growth ceiling
Customer Acquisition Cost - CAC
Customer acquisition cost (or CAC or Cost of Acquiring a Customer) is a metric used by all online businesses, not just subscription-based businesses/SaaS.
CAC is the cost associated with persuading someone to part with their hard-earned cash (or their company's cash, in which case everything gets easier 😀 ). It answers the question "How much money to we spend to get one additional customer?"
This number is important because it tells you how efficient your marketing and sales campaigns are. Plus, if your CAC is higher than your net LTV you are losing additional money with each new customer - not a happy place to be in for most self-funded startups.
While the costs of delivering a SaaS product (COGS)to the hands of your customers are typically less than 20% (and often less than 10%) of your LTV, CAC often is around 30 percent and can even reach 100 percent for growth periods.
Funded startups often find themselves in "growth at all costs" situations and so losing money on every new user isn't a big problem at first.
However, if you want to run a profitable, self-funded SaaS business your aim is to keep CAC below 30% of your LTV. I'll talk a bit more about this in the chapter on LTV-to-CAC ratio.
The difference between CAC and CPA
There is a certain confusion about the Customer Acquisition Cost (CAC) and the Cost Per Acquisition (CPA). The two are often used interchangeably, when they are not.
CAC is about acquiring a paying user. CPA is acquiring anything but a paying user - e.g. a lead, a trial user, an email subscriber.
CPA is the foreplay to CAC.
Calculating the Customer Acquisition Cost - CAC
You calculate CAC by summing up your marketing and sales expenses and dividing everything by the number of new paying customers in the interval:
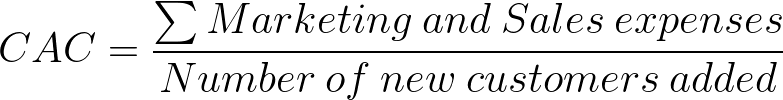
This is the basic formula and as such it is a good first approximation. Depending on how your product/marketing/sales are structured this formula is missing some details - e.g.:
Accounting for delayed sales cycles in your calculations
If you have a sales cycle greater than 30 days and you calculate CAC monthly, you need to account for that delay.
Else you'll spend 10,000 additional moneys in April, wonder why your CAC sky-rockets, and then have your CAC plummet in May because all those additional paying users finally arrive.
CAC considerations for freemium products
If you are following the freemium marketing model, you need to include the expenses of supporting a customer during their time as a free user in your CAC calculation.
For that you need to track how long the average customer stays on the free plan before they upgrade to any of the paid plans. Then you add the COGS over that time period to the CAC.
Andrew Chen has an in-depth explanation on the pitfalls of calculating CAC in this article.
Track CAC by traction channel
Ideally, you want to break down your CAC by traction channel (SEO, outreach, paid ads, etc.) because it dramatically differs between channels.
Say for example you spend $5,000 a month to get 100 customers through Google Adwords and $5,000 to get 250 customers through Facebook Ads - for a respective CAC of $50 and $20.
Would you like to know that? Or is it enough for you to know you're spending $29 on average across all channels?
Of course you want to know the details. Because then you can decide to optimize your Google Adwords campaigns to lower CAC. Or you decide to be more aggressive in your Facebook marketing because your LTV/CAC ratio gives you room for that.
Fact: You don't want an extremely low CAC, because that means you're missing out on customers. If your CAC is low you can invest more money in more marketing to reach more customers to make more money.
Segment CAC by plan/product
Additionally, you want to segment your CAC by the plan/product each customer ends up buying - just like you do with your LTV.
Knowing your CAC for each plan you're offering lets you check whether you are over-/underspending to acquire each type of customer. You can spend a lot more money to profitabily acquire a $50,000-LTV customer than a $500-LTV customer.
Ways to lower your CAC
CAC is one of the few metrics were less is better. The lower your CAC (the less money you spend to get a new customer) the better for your business. It helps with cashflow and it gives you opportunities to experiment with marketing and sales.
Here are the main ways to lower your CAC.
Convert more website traffic into trial users
The second lever you can pull to increase your number of signups is to convert more of your existing website traffic into (trial) users.
One way to increase your signup rate is by using Signup Abandonment Emails. I've used this tactic with a number of clients and consistently achieved a 10-15% increase in conversion rate.
Another way is to split test your website (copy) and improve your conversion rate step-by-step. Tiny steps really add up over time. Here's a list of 19 obvious A/B tests you should run on your website to get you started.
Here's another great article on optimizing your pricing page for conversions and revenue.
Convert more trial users into paying users
The third big lever you can pull is your "trial to paid conversion rate". The more trial users stay with you at the end of their trial and start paying you, the better for your MRR.
To improve your trial to paid conversion rate your focus needs to be on successful onboarding. The faster you get users to using your product (and receiving a ton of value from using it) the better your conversion rate will be.
Lifecycle emails can dramatically improve your product's onboarding experience. I've written a 4,000+ words in-depth article on trial end emails / upgrade emails that is a good primer on the topic.
I've also written up my experience from lowering Moz's churn rate by 40 percent with a single actionable onboarding email. Both articles contain a ton of actionable advice on how to supplement your in-app onboarding process with helpful emails to maximize your conversion rate.
CAC payback period
Imagine this: You're spending $475 to acquire each customer on your $39/month plan. How long does it take to make back the money you spent on acquiring the customer?
That's what CAC(Customer Acquisition Cost) payback period tells you. For the above example with a CAC of $475 and an ARPU of $39 the answer is "a bit more than 12 months".
Why the CAC payback period is important
This metric is tightly coupled to your cash flow. The longer it takes to recoup your CAC the harder it is to manage your cashflow.
You're spending a lot of money to get the customer and you're only slowly getting that money back. Think of it as a loan you hand out to each customer that slowly gets paid back over time.

The problem is when you hand out more loans than you have cash in the bank, you go bankrupt.
Take the above example again: You get 10 customers each month, which costs you $4,750 - and you only get $390 back the first month. The second month you again spend $4,750, but get back $390 + $390 = $780. The third month it's $4,750 vs. $1,170.
If you have less than $10,000 in the bank, your startup will fail in the third month.
Bottom line: The faster you recoup your CAC investment, the better for you.
How to calculate your CAC payback period
The calculation for this metric is super simple:
How to recoup your CAC faster
The simplest solution for recouping your CAC faster is to charge each new customer an implementation fee.
Looking at the example again, you can almost cut your CAC payback period in half by charging a setup fee of $199.
Of course, you don't need to charge every single customer for it and instead offer it as a paid add-on. Bluehost for example, charge $150 for migrating your websites to them - something their competitors give away for free.
As a bonus, implementation fees increase your SaaS retention rate as ProfitWell showed in this report.
An implementation fee essentially lowers the CAC of your SaaS. Additionally, you can lower your CAC - and thereby shorten your CAC payback period - by paying less for traffic (e.g. optimizing your Adwords campaign) and increasing the signup conversion rate.
Alternatively, you can always increase ARPU with the tips mentioned in the chapter on ARPU.
Cost Of Goods Sold - COGS
Cost of Goods Sold - or COGS for short - is the marketer's way of saying "This is how much it costs to keep systems running and to service each customer".
What to include in COGS for SaaS businesses
On the surface level, you might think of COGS as the servers your SaaS app runs on - and not much else.
But upon closer inspection, you'll notice a lot more things should be included in COGS. Take "servers" for example, or rather "hosting". Hosting includes at a minimum the following items:
- Servers (AWS bill, electricity, maintenance, deductions, etc.)
- software licenses for running the servers - e.g. Windows Server 2019
- SSL certificates
- Domain names
- employee costs for keeping the production environment running
Additionally, there is a host of other expenses that need to be factored into COGS for any SaaS business - such as:
- third-party software/data costs that are delivered inside/with your product (e.g. APIs)
- customer support/success (but without upsells, that's a marketing expense)
- anything required to deliver the ongoing service
Now: You'll have a hard time exactly attributing how much of your customer success expenses are related to upselling existing customers to deduct it from your COGS. But that isn's the point here.
The point is: The question of what to include in COGS for SaaS businesses is nuanced one and you'll have to refine the calculation as your business matures.
Guidelines on COGS
So while a lot of different expenses factor into COGS, net margins for SaaS products are still pretty high on average.
The rule of thumb I've heard is that your COGS should stay below 1/3 of LTV - which isn't that hard to achieve for most SaaS.
Churn
Churn, the mother of all SaaS metrics. If you ask 100 SaaS CEOs what the #1 metric they care about is, I bet you'll get at least 50 mentions of churn or retention - and rightfully so.
High churn is a tremendous obstacle in your product's growth path. And getting churn to go down is hard work.
So let's take a close look at this wonderful metric.
Customer churn vs. revenue churn
Customer churn (sometimes also called user churn, account churn or logo churn) is the answer to the question "If we start a pay period with 100 customers, how many of those customers will cancel during this period?"
A pay period can be whatever you like, although churn is most often calculated on a monthly or annual basis - depending on whether you charge the customers monthly or yearly.
Notice that newly signed-up customers don't factor into the equation at all. Churn/Retention is solely looking at how well a product is retaining existing customers.
Customer churn is focusing on the raw number of customers that churn each billing cycle.
In contrast, revenue churn tells you what percentage of revenue you lost during each billing cycle.
Revenue churn is the more commonly used metric for multi-tier subscription businesses because losing five small customers has a smaller effect on your business than losing one huge customer. Revenue churn factors in the value each customer has for your SaaS business better than logo churn does.
Net revenue Churn and the Holy Grail of Net Negative Churn
Another form of churn that is often talked about is net revenue churn.
But before we go into what net churn is (and how to achieve the mythical net negative churn), we need to take a closer look at what contributes to revenue churn.
So let's get busy. Three components make up net revenue churn:
- cancellation churn
- contraction churn
- expansion revenue
Cancellation churn is the revenue you lose because customers cancel. If a customer on your $49/month plan cancels, your cancellation churn amounts to $49.
Contraction churn is the revenue you lose because a customer downgrades their plan. Another $49/month customer decides to change to the $29/month, so your contraction churn is $20.
Expansion revenue is the opposite of contraction churn: Additional MRR you get because a customer upgrades their plan. A customer switching from your $49/month to your $149/month plan means your expansion revenue is $100.

To complete the example, assume you had $1,000 MRR at the beginning of the month and the three cancellations, downgrades, and upsells happened as described. Then here's the result:

In this example, the net revenue churn rate is -3.1 percent. A negative number here constitutes net negative churn.
So what is net negative revenue churn?
Net negative churn is the Holy Grail in the realms of SaaS. Net negative churn means that your expansion revenue is higher than your churn.
The effects are astonishing: Even if you were not recruiting any new customers, your MRR would grow over time.
Having a net negative churn rate eliminates your MRR growth ceiling. It's just completely gone.
So you can go to the beach, sip on your Mojito, and see the money roll in. Just wait a year or two and then buy Amazon from Jeff...
How to achieve net negative churn
The problem with net negative churn is that it is hard to achieve.
Think about it, you need to make more money from your remaining customers each month. Their number is dwindling every month, but the select few survivors need to give you more money. This makes it clear that you do need fresh customers in the door or else your net negative churn will be a short-lived phenomenon.
It's still a worthy goal to strive for as every reduction in churn results in a big increase in your MRR growth ceiling and your MRR over time.
Here's a little chart for you to show the effect of churn and net negative churn. On the X-axis you have months since the start and the Y-axis is MRR in dollars. The business in this example starts at $10,000 MRR and there are four scenarios (10%, 5%, 2% and -2% churn):
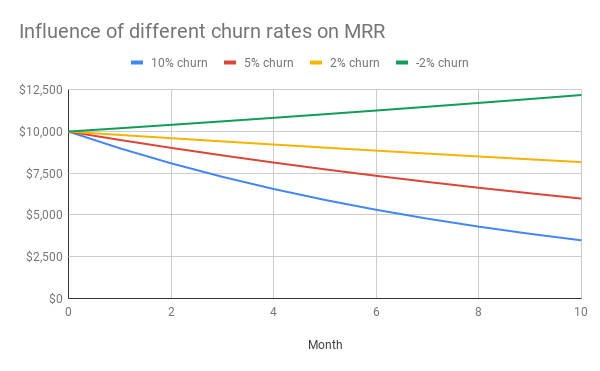
After just 10 months, the 10% churn business has lost 2/3 of its revenue (MRR down to $3,487), while the 5% business has lost 40% ($5,987), the 2% churn business has lost only 18% ($8,171). The negative 2% business meanwhile increased MRR by almost 22% ($12,190).
In other words, the net negative churn business has almost a 4x higher MRR after just 10 months compared to the business with the worst churn in this example.
Reasons customers churn
Customers churn for a number of reasons and the prevalence of each reason depends on the market you are serving, your product, and a bunch of other things.
However, there are two major groups of reasons: Voluntary churn and delinquent churn.
Delinquent churn is caused by customers whose credit card is failing. If they don't update their card information in time, they'll churn.
Voluntary churn is when customers actively decide to cancel. You can split up this group into different segments - e.g.:
- switching to a competitor
- going out of business
- 60/90 day churn (Onboarding churn)
60/90 day churn focuses on how much churn you experience in the early days of the customer journey. I like to call the 60/90 day churn "Onboarding churn" because when it's high, that is an indicator that your app is failing to onboard customers properly. Here's an example of how the churn curve looks like with onboarding churn:
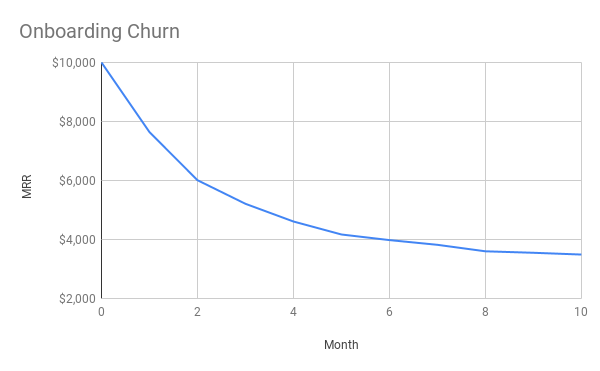
This example is by no means exagerated. I've used real data from one of my clients for the 30/60/90 day churn and their average churn rate (excluding 90 day churn) after month 3.
How to reduce churn in your subscription business
By now you'll have realized that not all churn is created equal, but that all churn is bad.
But how can you reduce churn in your SaaS business?
For delinquent churn, the answer is pretty simple: There are numerous products out there that help you combat delinquent churn - such as Revively, Churnbuster* and ProfitWell Retain.
Here's a success story that Daniel Kempe, the CEO of Quuu, shared with me:

At Quuu and at any SaaS company failed payments accounts for about 40% of all churn, so dealing with that is an easy win to reduce overall churn. We use tools like Revively.co to automate the dunning process. Revively sends automated messaging campaigns to recover failed payments with reminders and ways to update payment information. It simply works for you in the background and has so far recovered over $3.5k in little over a month which resulted in a 2% reduction in overall churn.
Dealing with delinquent churn is all about dunning, i.e. reminding your customers to update their credit card information. Stripe has some built-in dunning capabilities, but any of the above mentioned tools will improve your results - and they are all essentially free to use as they make you money.
When it comes to other types of churn, I've written more extensively about onboarding churn and how to reign it in on my blog.
This is one way to combat onboarding churn, but the underlying strategy is to understand your customers and their initial journey through your app. Once you've reached that understanding, you can work to lead them down the Minimum Path to Awesome as fast as possibly
Generally speaking, to minimize churn you need to align your product with your customer's needs. Your product needs to fullfil a need in your customer's life/business. The pain they feel needs to be continuous, not intermittent; e.g. many people only marry once in their lieftime - not ideal for a subscription business.
However, even after you've achieved that, there are some tactics you can use to lower churn:
- get more people on annual plans
- higher tiers experience lower churn, move as many customers as possible to higher tiers
- when customers cancel, offer them a discount if they stay or offer a downgrade
Quick Ratio
The Quick Ratio is a measurement of how efficiently a SaaS is growing. Think of it like this: When MRR is your current speed, then Quick Ratio is your acceleration.
Calculating your quick ratio
To calculate your quick ratio you add new MRR and expansion revenue. Then you divide the result by the sum of churned MRR and contraction MRR (See the chapter on Churn for more information). Here's the full formula:

Quick Ratio calculation example
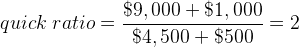
Here's a quick example of how to calculate your quick ratio. Your raw values are as follows:
- new MRR: $9,000
- expansion revenue: $1,000
- lost MRR: $4,500
- contraction MRR: $500
Substitute this into the above formula and you get a quick ratio of 2:
What is a good quick ratio?
There's no consensus on what a good quick ratio is. Venture capital-financed companies, where growth is everything, strive for a quick ratio of 4 or bigger. But even for VC-backed companies quick ratio isn't everything, so if you're bootstrapping don't worry too much about your quick ratio.
Customer Lifetime (CLT)
Mathematically speaking.... hey, are you still there? Don't worry, it's really simple math. Pinky swear.
Anyways, Customer lifetime (CLT) or "How long is the average customer staying with us?" is the inverse of your churn rate.
Let me explain it with an example. When you have a 5 percent churn rate that is a factor of 0.05. When you divide 1 by 0.05, the result is 20 - meaning your average customer is staying with you for 20 months.
See? I promised it'd be simple.
To be frank, customer lifetime is not a metric that gets talked about very often. It's important as a part of the formula for customer lifetime value.
There is only one thing you should keep an eye on when it comes to the customer lifetime: If your customer lifetime is shorter than your Customer Acquisition Cost payback period, you're burning cash.
Customer Lifetime Value - LTV / CLTV / CLV
Customer lifetime value is one of the most important metrics in your SaaS business. There are a number of abbreviations for it - either LTV, CLTV or CLV.
The customer lifetime value tells you how much your average customer spends with you over the course of their lifetime. Or phrased as a question: "How much is each new customer worth to the business?"
Why Customer Lifetime Value is such an important metric
LTV is so important because it tells you how much money you can spend acquiring and servicing each customer and still turn a profit.
As long as your LTV is greater than the sum of your Customer Acquisition Cost (CAC) and your Cost of Goods Sold (COGS).
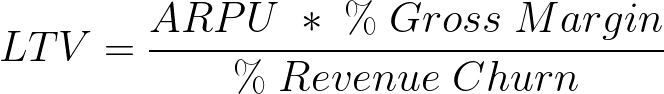
How to calculate customer lifetime value
The calculation for customer lifetime value is not that complicated. You simply multiply the Average Revenue Per User (ARPU) with the Customer Lifetime (CLT). Because CLT is 1 divided by Churn, you can also calculate CLTV by dividing ARPU by Churn.

This will give you your gross customer lifetime value. To calculate your net customer lifetime value, you can either simply subtract your COGS from your gross customer lifetime value OR you multiply ARPU by your gross margin.
Calculate your customer lifetime value for different segments
Because your ARPU and your churn rate are different for different customer segments, your LTV is too.
Customers on a higher tier plan have a higher LTV - because their ARPU is higher (obvious) and because their churn is lower (not so obvious).
Customers on annual plans (vs. monthly plans) have a lower (monthly) ARPU but their churn is also lower, so they usually end up with a much higher CLTV.
These are the two most common segments you want to look at: pricing tier (and version, if you've changed your pricing) and billing cycle length.
On top of that, you can also calculate your LTV for different acquisition channels (paid vs. SEO vs. social...) and derive interesting conclusions from that. More on that in the section on LTV to CAC ratio.
LTV to CAC ratio
Your Customer Lifetime Value to Customer Acquisition Cost ratio (LTV to CAC ratio) is a valuable metric for your marketing and sales efforts. It gives you a quick overview of how efficiently you are acquiring customers.
The rule of thumb for your LTV to CAC ratio is to keep it at least 2:1, better 3:1. Here's how you ideally split up your LTV:
- Spend one third on acquiring customers (CAC)
- Spend one third on servicing customers (COGS)
- Keep one third as profit or invest in growth
Let me explain that with an example. When your CLV is $100, that means you aim to spend $33 on CAC to acquire each new customer, you spend another $33 on servicing this customer and the last $33 to grow your business (or as take-home profit).
From the $33 (soft) limit on CAC you can work your way backwards: What's your current visitor-to-customer conversion rate? How much can you spend on acquiring a visitor?
For example, if your visitor-to-customer conversion rate is 2 percent, that means you can spend 66 cents on acquiring each visitor. Now, two percent conversion rate is pretty great. I've not seen many businesses pull that off. Yet you only have 66 cent to spend per visitor. That means it'll be quite hard to get paid ads working - at least Google Adwords. Buying paid traffic will likely be more expensive.
This kinds of deductions make LTV to CAC ratio super useful for marketing.
Compound Annual Growth Rate - CAGR
The compound annual growth rate (CAGR) comes in really handy to understand business growth over multiple years.
The formula is most scary of all formulas on this page, but I promise it's well within the reach of your calculator ;-)
First of all, you divide the MRR at the end of the period by the MRR at the beginning of the period.
Next, you take that result and take it to the power of (1/n) - where n is the number of years. Lastly, you subtract 1 from the result.
And that gives you the compound annual growth rate.
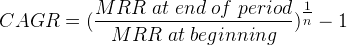
Let's look at an example, over the 2014 - 2019 (5 years) time period your MRR grew from $10,000 to $100,000.
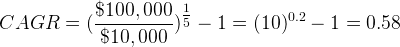
In the example, the business grew an average of 58% each year over that time period.
Bonus: MRR to Lines of Code - MRR-to-LOC
MRR to Lines of Code is a metric that is without value or merit. It was dreamt up by my friend Michael Koper here on Twitter.
Just found out that my MRR to Line's of code rating is $1.88 for every line of code 😂. What is yours?
— Michael Koper (@michaelkoper) 4. Juli 2019
So what does this tell you? Absolutely nothing. It's just for fun.
SaaS Metrics Explained - Conclusion
I hope that this guide was able to shed some light on the vast topic of relevant metrics for subscription businesses. If you have any more questions or suggestions, let me know on Twitter @itengelhardt